Corporate Eco-efficiency Sustainable

Development is an important element for Banco de Chile and, therefore, it implements diverse initiatives to mitigate the impact of its operations on the environment, whether from the consumption of natural resources or direct or indirect emissions.
The bank's environmental management is governed by its Environmental Sustainability Policy, issued by the board and published on its website/2.
According to the policy, “financial institutions in general, and banks in particular, have a key role as economic catalysts as they impact people's quality of life. Their products and services respond to the needs and objectives of society. The purpose of this policy is to advocate for the reduction of environmental impact, thus contributing to financial stability and the achievement of Chile's commitments in environmental matters.”
Priority action areas include:
- a) Legal compliance
- b) Energy and climate change
- c) Waste and recycling
- d) Operational efficiency (use of resources)
- e) Employees (personnel involvement and awareness)
- f) Supplier management
- g) E-commerce and green products
- h) Banking and financial activity
The Administration Department, which reports to the Financial Reporting and Control Division, and the Corporate Affairs and Sustainable Department, which reports to the People and Organization Division, are jointly responsible for policy design and implementation.
In this context, the bank has implemented diverse programs to improve energy efficiency and reduce paper use, as well as manage solid waste, care for water resources and promote efforts to reduce greenhouse gas (GHG) emissions. Furthermore, as part of the corporate volunteer program, it develops initiatives to mitigate pollution and restore or rehabilitate degraded areas.
To monitor these programs, the corporation uses goals and indicators, which are reviewed and updated on a yearly basis.
In 2020, the bank achieved its environmental management goals, with the exception of recycling. Bear in mind that these measurements incorporate the effects of temporarily closing branches and the reduced number of employees working at corporate offices as a result of public health restrictions. Therefore, goal achievement was biased due to reduced operations during the pandemic, which should be considered in comparing it with last year’s performance in each item.
The main milestones of the bank's environmental management during 2020 include:
- o Approving the Environmental Sustainability Policy.
- o Monitoring internal environmental goals, a new and positive environmental management practice.
- Externally verifying the information reported in the environmental chapter in conformity with Global Reporting Initiative (GRI) standards.
Banco de Chile was recognized by Dow Jones Sustainability Indicesfor its progress in environmental, social and governance (ESG) issues.
The Bank`s achievement and updating of its goals is described as follows
Aspect | Indicator | Type | Year 2020 | Year 2021 |
Energy | Electricity consumption | Goal | Reduce by 1,5% | Reduce by 3% |
Performance(*) | Reduced by 12% | Report in2022 | ||
Climate Change | GHG emissions | Goal | Reduce by 2,5% | Reduce by 5% |
Performance | Reduced by 12% | Report in 2022 | ||
Paper | Paper comnsumption (kg) | Goal | Reduce by 8% | Reduce by 16% |
Performance | Reduced by 42% | Report in 2022 | ||
Recycling | Recycling rate (%) | Goal | Increase by 5% | Increase by 5% |
Performance | Reduced by 3% | Report in 2022 | ||
Water | Water consumption (l/m2) | Goal | Reduce by 2% | Reduce by 2% |
Performance | Reduced by 7% | Report in 2022 |
Energy
Sixty percent (60%) of the bank's total energy consumption can be attributed to operating air conditioning and heating equipment, which is why energy efficiency programs focus on automating this equipment and upgrading less efficient units.
Meanwhile, 25% of energy consumption comes from lighting and computer equipment. In 2020 it continued to upgrade lighting from fluorescent to LED, completing the process at 25% of branches.
The remaining 15% of energy consumption is used by office equipment (pumps, elevators, printers, photocopiers and telephone banking, etc.).
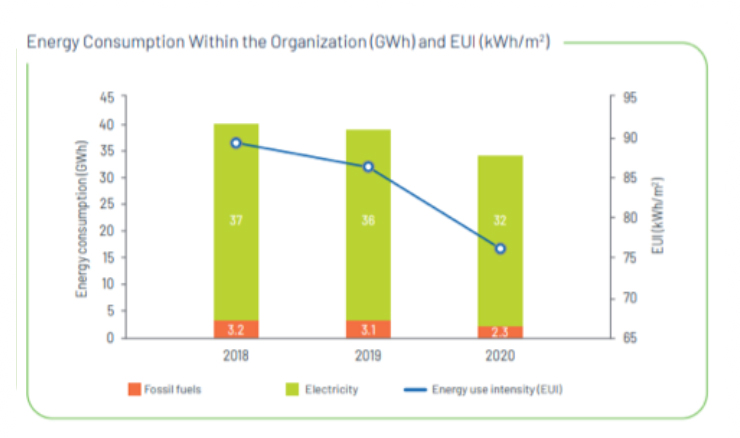
In 2020, and as an overall result of the different programs and initiatives implemented, the bank managed to reduce its energy use indicator by 10% with respect to the prior year.
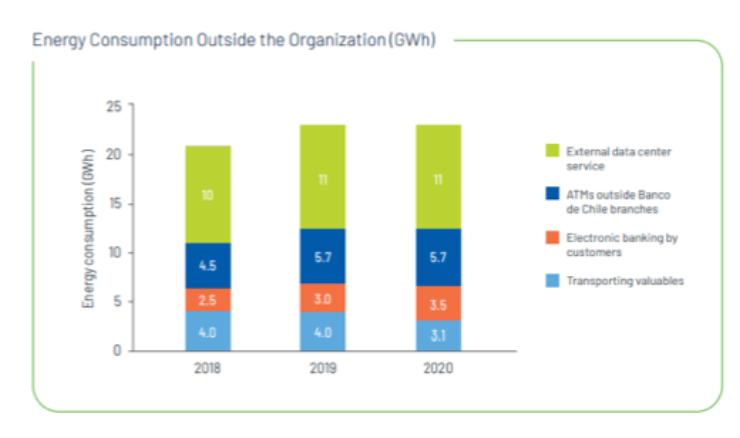
In addition, it continued to identify and quantify energy consumption external to the bank in order to detect potential room for savings. Based on this activity, it concluded that to the extent that the bank strengthens its online customer service channels, it reduces internal energy consumption, while increasing, in a smaller proportion, external energy consumption.
Energy Consumption Within the Organization 2018-2020
Aspect | Unit | 2018 | 2019 | 2020 |
Fossils fuels | GWh | 3,2 | 3,1 | 2,3 |
Electricity | GWh | 37 | 36 | 32 |
Total energy requiered by the organization | GWh | 40 | 39 | 34 |
Banco de Chile network area(*) | m2 | 453.931 | 450.731 | 450.436 |
Energy use intensity | kWh/m2 | 89 | 86 | 76 |
Energy Consumption Outside the Organization 2018-2020
Aspect | Unit | 2018 | 2019 | 2020 |
Transporting valuables | GWh | 4,0 | 4,0 | 3,1 |
Electronic banking by customers | GWh | 2,5 | 3,0 | 3,5 |
ATMs outside Banco de Chile branches | GWh | 4,5 | 5,7 | 5,7 |
External data center service | GWh | 10 | 11 | 11 |
Total energy required outside the organization | GWh | 21 | 23 | 24 |
Greenhouse Gas Emissions (GHG)
Banco de Chile updated its carbon footprint measurement considering direct and indirect greenhouse gas emissions (GHG).
BThe carbon footprint was measured with assistance from the engineering company Proyectae3/, based on the method in the Greenhouse Gas Protocol4/. Corporate GHG emissions were quantified using the 2004 Corporate Accounting and Reporting Standards (Corporate Standard)5/ and the intensity indicator for products was quantified using the 2011 Product Life Cycle Accounting and Reporting Standard6/.
BThis process involved data center service providers, valuables transporters and couriers, which provided the information needed to calculate and extend the scope of carbon footprint measurements to its value chain. In 2020, the carbon footprint was 52 thousand tons of carbon dioxide equivalent (52,422 tCO2e) and the main sources of GHG emissions were customer transport to branches, electricity consumption and daily employee transport to work.
3/ www.proyectae.cl.
4/ www.ghgprotocol.org
5/ www.ghgprotocol.org/standards/corporate-standard.
6/ www.ghgprotocol.org/standards/product-standard.
Organizations´s Direct and Indirect Greenhoyse GAS (GHG) Emissions 2018-2020
Scope | Category | 2018 | 2019 | 2020 | |
tCO2e | tCO2e | tCO2e | % | ||
1 | Fixed-source combustion | 57 | 63 | 82 | 0,1% |
1 | Mobile source combustion | 806 | 770 | 523 | 1% |
1 | Leakege emissions | 900 | 874 | 606 | 1% |
| Subtotal scope 1 | 1.763 | 1.707 | 1.211 | 2% |
2 | Electricity consumption | 15.910 | 14.643 | 13.088 | 20% |
| Subtotal scope 2 | 15.910 | 14.643 | 13.088 | 20% |
| Subtotal scope 1+2 | 17.673 | 16.349 | 14.299 | 23% |
3 | Customer transport | 39.460 | 35.284 | 21.020 | 49% |
3 | Employee transport | 8.013 | 7.996 | 5.624 | 11% |
3 | External data center service | 4.165 | 4.304 | 4.654 | 6% |
3 | Electronic banking by customers | 2.944 | 3.653 | 3.721 | 5% |
3 | Business trips | 1.687 | 1.714 | 881 | 2% |
3 | Others | 3.378 | 3.260 | 2.224 | 4% |
| Subtotal scope 3 | 59.648 | 56.211 | 38.124 | 77% |
| Total GHG emissions | 77.321 | 72.561 | 52.422 | 100% |
Intensity of GHC Emissions 2018-2020
Emissions | Unit | 2018 | 2019 | 2020 |
GHG emissions (A1-2) per unit of surface area | kgCO2e/m2 | 39 | 36 | 32 |
The total carbon footprint was reduced by 28% with respect to the prior year and the intensity indicator (as a function of branch surface area) fell 12%.
One of the corporation's primary environmental impacts is daily employee transport to work. Fuel is burned as they travel to and from their workplaces, which generates GHG emissions. Consequently, in 2015 the bank began to implement initiatives to promote sustainable employee commutes, including BiciChile and Commute with Banco de Chile (“Viaja con el Chile”). However, because 2020 was not a normal year, program continuity was affected.
In the same context, during the period Banco de Chile backed working from home and will continue to do so until public health conditions allow it to return to offices.
The emissions management goals for 2021 are in line with the Science Based Targets initiative, which contributes to the goal of keeping the Earth's temperature increase below 2°C. Accordingly, the bank expects to achieve an annual emission reduction of 5% compared to the base year in 2019.
Waste and Recycling
Another source of environmental impact is solid and liquid waste, which for the most part is produced in facilities such as dining halls, corporate offices and branches.
During 2020, the bank continued to recycle waste and involve all employees, making them protagonists of the program We Choose to Recycle at Banco de Chile! (“¡En el Chile decidimos reciclar!”). The project entailed installing 228 recycling points in the Metropolitan and Valparaíso regions, including branches, headquarters and corporate offices.
The recycling sites manage solid waste such as paper, PET plastic bottles, glass, cans and batteries. The waste collected at each site is removed every week by providers who certify the removal procedure and transfer it to recycling plants7/, where it is processed and converted into other products. As of year-end 2020, 92 undisclosed tons of paper, cardboard, plastic, glass, aluminum and electronic waste had been recycled through the program.
In terms of obsolete computer equipment resulting from technological upgrading processes, the bank continued to work with the Chilenter Foundation8/ to collect and sustainably transform its electronic waste. Six tons of e-waste were recovered in 2020 through this Alliance.
Waste by Type and Final Disposal Method 2018-2020
(toneladas)
Waste | Unit | 2018 | 2019 | 2020 |
Banco de Chile (buildings + branches) |
|
|
|
|
totale generated | t | 2.009 | 2.053 | 1.486 |
Corporate buildings, total generated | t | 1.421 | 1.461 | 894 |
Recycling rate | % | 11% | 10% | 10% |
Non-hazardous to landfill | t | 1.265 | 1.320 | 802 |
Recycling and/or treatment | t | 156 | 141 | 92 |
Paper and cardboard | t | 154 | 115 | 61 |
E-waste: batteries | t | 0,91 | 0,84 | 0,30 |
E-waste: CPU, screens and others | t | 1 | 11 | 6 |
Other recyclables (Kyklos) | t | 0 | 15 | 25 |
Branches, total generated | t | 587 | 592 | 592 |
7/Recycling plants such as Recipet, Metalum, Comberplast, Cristalerias Chile and SREPA
8/ www.chilenter.com
The recycling rate was 7% at corporate offices, below the goal of 15%. As mentioned at the beginning of this chapter, partial closures of branches and telecommuting programs involving a significant number of employees had a direct impact on measurements, some of which do not allow accurate comparison with last year’s performance. In the particular case of the recycling rate, there was a change in waste composition. For example, less paper and cardboard were generated but there was an increase in janitorial and disinfection supplies.
Chile Without Waste Proyect 2040
Driven by Kyklos, a B Corporation focusing on environmental culture, this project aims to reduce, reuse and recycle 100% of trash by the year 2040. This is a major challenge since Chile is the South American country that generates the most trash per capita, averaging more than 1 kilo per day per person.
In order to help accomplish this goal, Banco de Chile joined the campaign by committing participation from both management and employees in various initiatives involving the project’s four dimensions: Education and Culture, Infrastructure and Logistics, Design and Construction, and Public Policy.
In 2020, the initiative made a broad impact through its social media (Facebook and Instagram), with an active community of more than 175 thousand followers.
Purchase and Use of Consumables
Paper is an important consumable for the corporation and its main waste product. Therefore, efficiently using paper has become one of the focuses of managing internal environmental impacts.
The year 2020 was not a period of normal operations, with lower sales volumes and telecommuting by a large portion of employees, thus leading to significant reductions (42%) in consumption of paper and other operating materials and supplies.
Paper Consumption 2018- 2020 (t)
Supplies | Unit | 2018 | 2019 | 2020 |
Paper consumption | t | 606 | 491 | 286 |
It is important to highlight the bank's management of hygiene and personal protective equipment (face masks, hand sanitizer, gloves, thermometers, etc.) during the pandemic. For this purpose, it established consumption standards and a centralized logistics process for rationing and ensuring availability at more than 250 customer service points and in common areas. The bank managed to keep sufficient back-up stock of these materials, optimizing consumption through analysis, training and reinforcement.
During the first half of 2021 the bank plans to finalize the process of upgrading personal and multi-functional printers throughout the bank, reducing the number of machines from 7,000 to 4,000. The new functionalities include validating users by scanning their corporate ID card, which will help prevent duplicate or unnecessary printing. Information systems will also allow the bank to analyze the types of documents and users with the highest consumption and, therefore, identify ways to improve.
Water
Although water is not one of the main variables of the bank's environmental impact, it recognizes the importance of efficient water management and supports the national commitment to preserve it. Sustainably managing water involves regulatory compliance, defining metrics and continuous monitoring in order to properly manage the resource.
The bank introduced water efficiency initiatives some years ago and began reporting collected information in 2019. Water supplies at all facilities come exclusively from public drinking water systems.
Water Consumption by Source 2018 - 2020 (in millions of cubic meters)
Water | Unit | 2018 | 2019 | 2020 |
Supplied by third parties | M m3 | 0,30 | 0,28 | 0,26 |
Surface water | M m3 | 0,00 | 0,00 | 0,00 |
Groundwater | M m3 | 0,00 | 0,00 | 0,00 |
Total water extracted | M m3 | 0,30 | 0,28 | 0,26 |
Water consumption per unit of surface area | m3/m² | 0,66 | 0,62 | 0,58 |
Water consumption fell 6%, surpassing the goal of 2% reduction. For this resource, as with prior years, one must factor in drops in employee and customer occupancy because of the pandemic..

